June 10, 2026
What Thousands of Tesla VINs Reveal About Battery Health
Speckr's live Tesla VIN data shows how battery health changes by model, chemistry, and age, and why vehicle-specific battery health matters when evaluating a used Tesla.
Update, June 12, 2026: We refreshed the charts to use a curved trend line instead of a linear regression, better reflecting the observed pattern of faster early battery-health decline followed by a more gradual taper.
Live battery health is becoming a clearer used-Tesla signal
Speckr can decode a Tesla VIN's original configuration, current Autopilot software, Supercharging access, and live battery health straight from Tesla.
For the past few months, users have been using Speckr to learn more about their own cars, research used Teslas before making a purchasing decision, and help dealers better understand options and equipment when buying inventory or educating customers. The result is a large and growing set of decoded Tesla VINs with battery-health data attached.
With thousands of decoded Tesla VINs, Speckr can now reveal meaningful fleet-wide battery-health patterns. The charts below look at state of health, or SoH, across models, battery chemistry, cell type, and vehicle age.
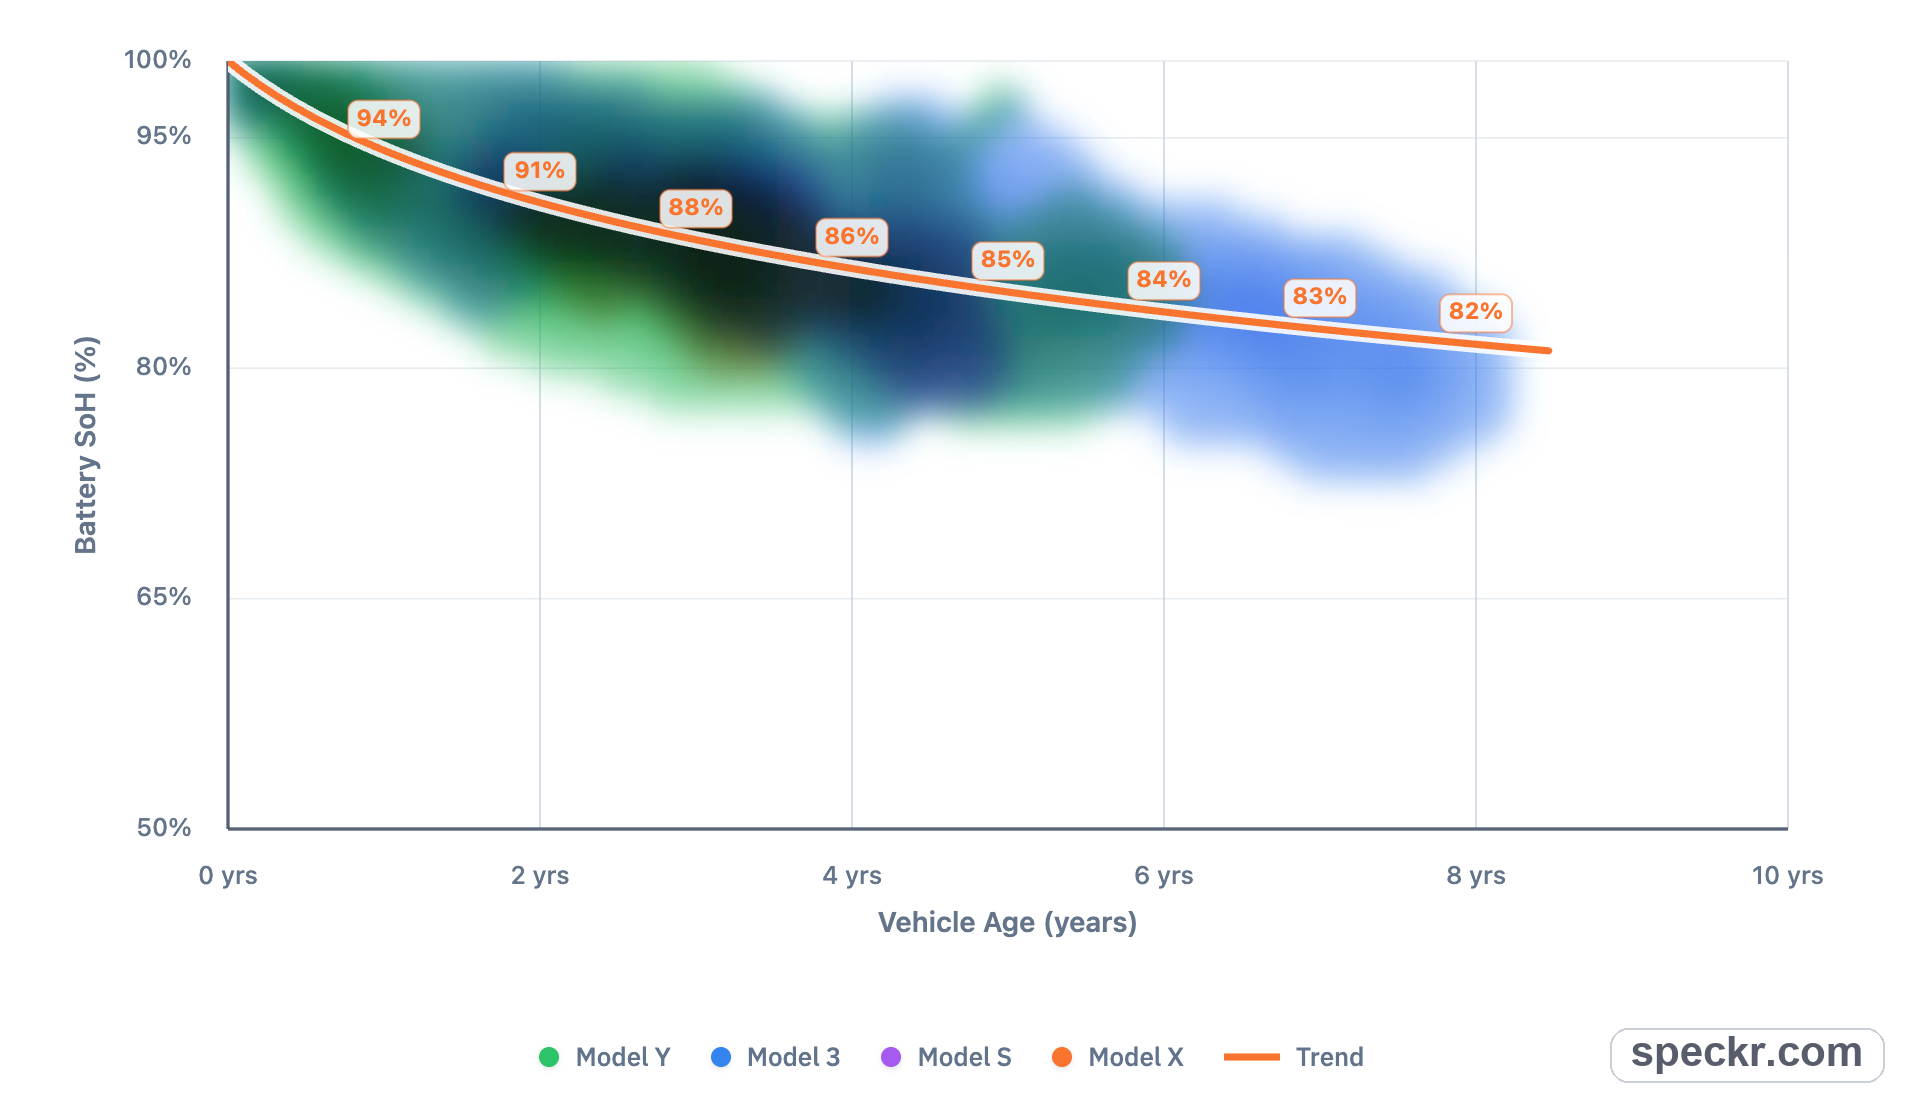
What the model-level view shows:
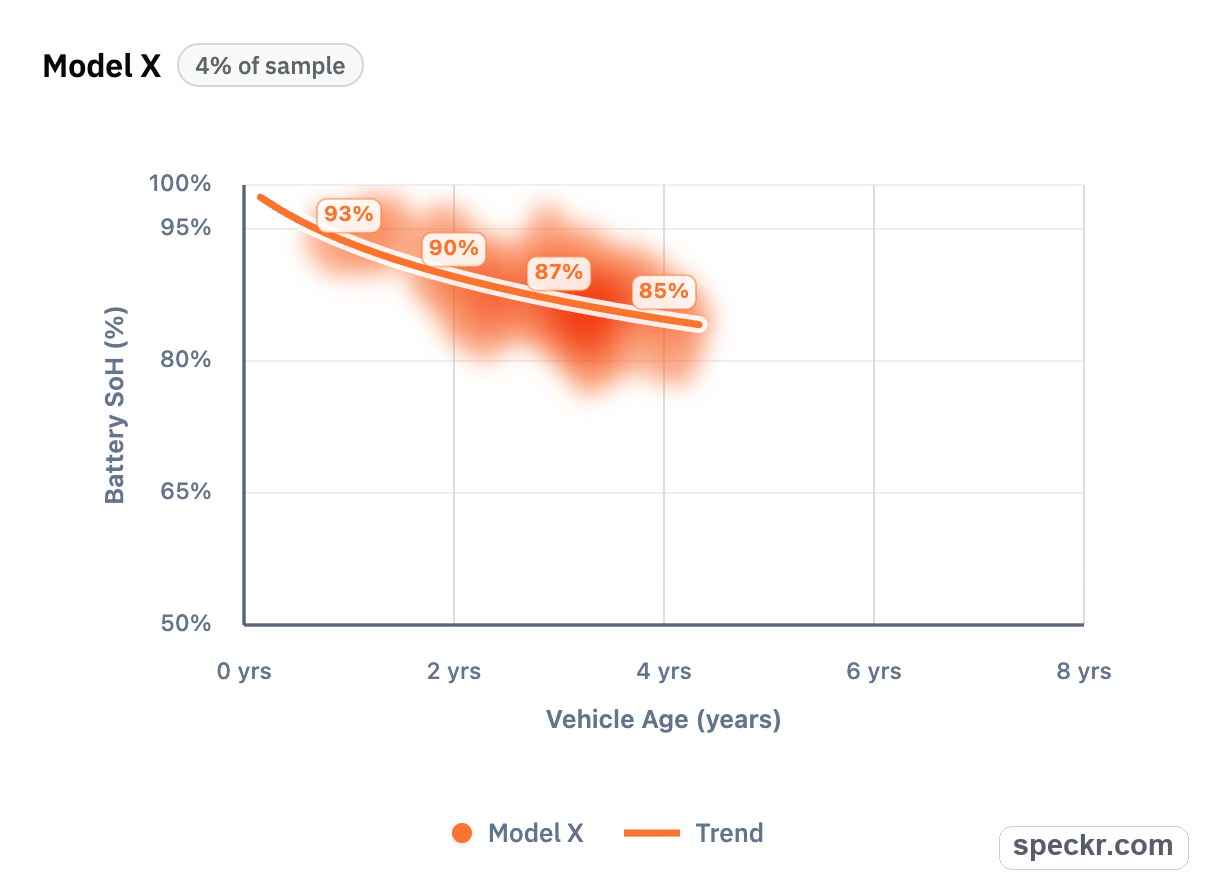
The model-level sample is heavily weighted toward Model Y and Model 3. In this view, Model Y represents 53% of the sample and Model 3 represents 37%. Model S and Model X are smaller cohorts at 6% and 4%, so their trends are useful context but should be read with that smaller sample size in mind.
Across the model overlay, the broad direction is gradual decline rather than a cliff. That matters for used-car research: battery health changes with age, use, and history, but the individual VIN still matters because one car can sit above or below the fleet average.
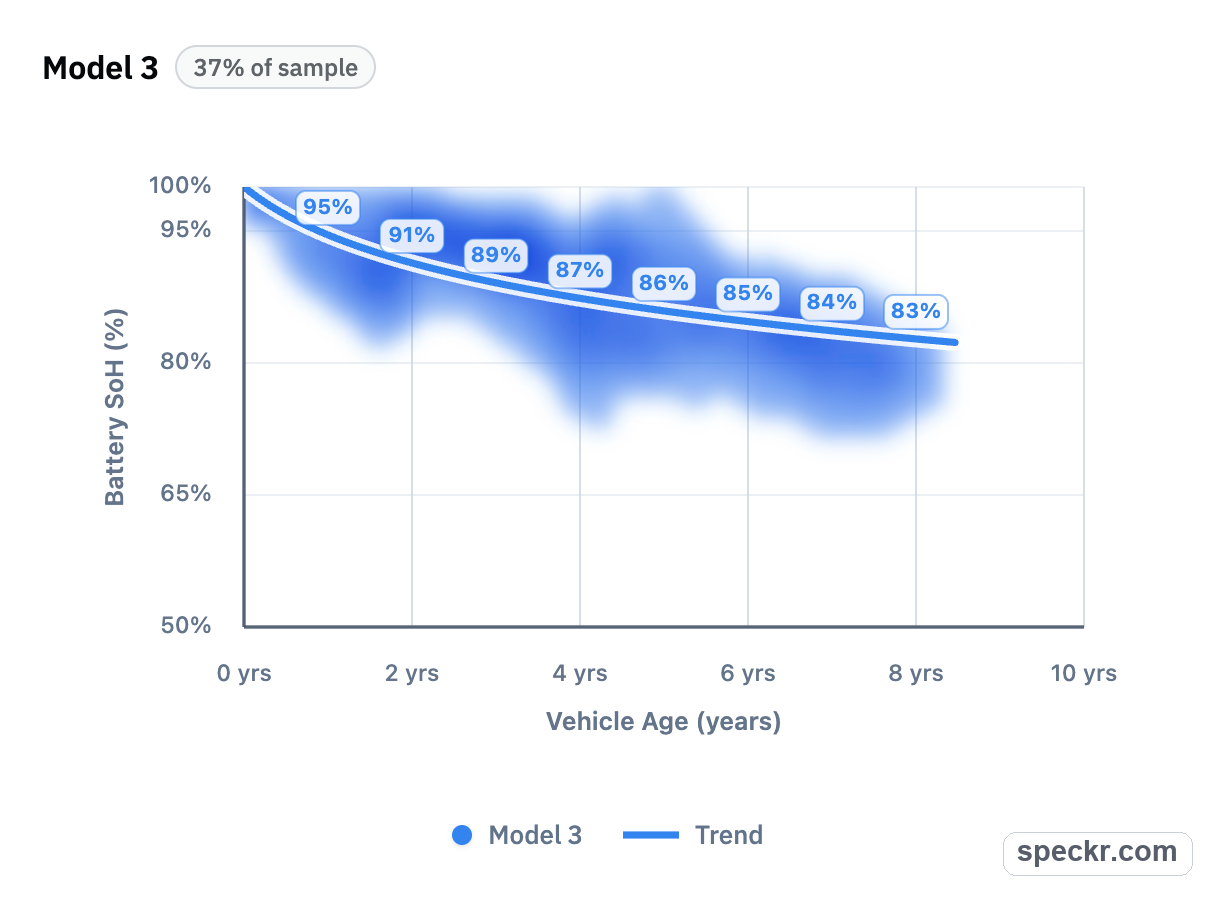
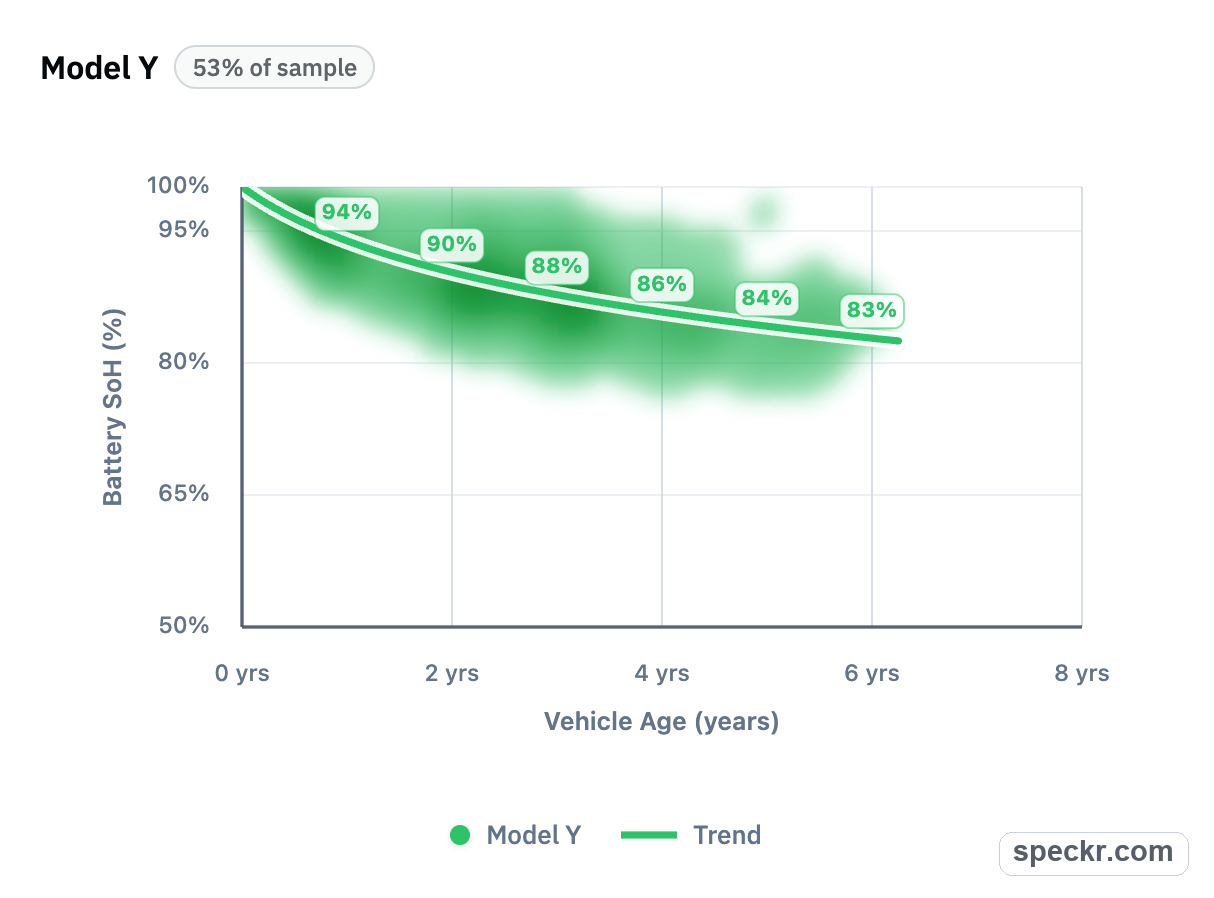
Model 3 and Model Y dominate the current sample
Model 3 spans the widest age range in this view, which makes it useful for seeing how SoH changes as the vehicle population gets older. Model Y is slightly newer as a fleet and makes up the largest share of the sample.
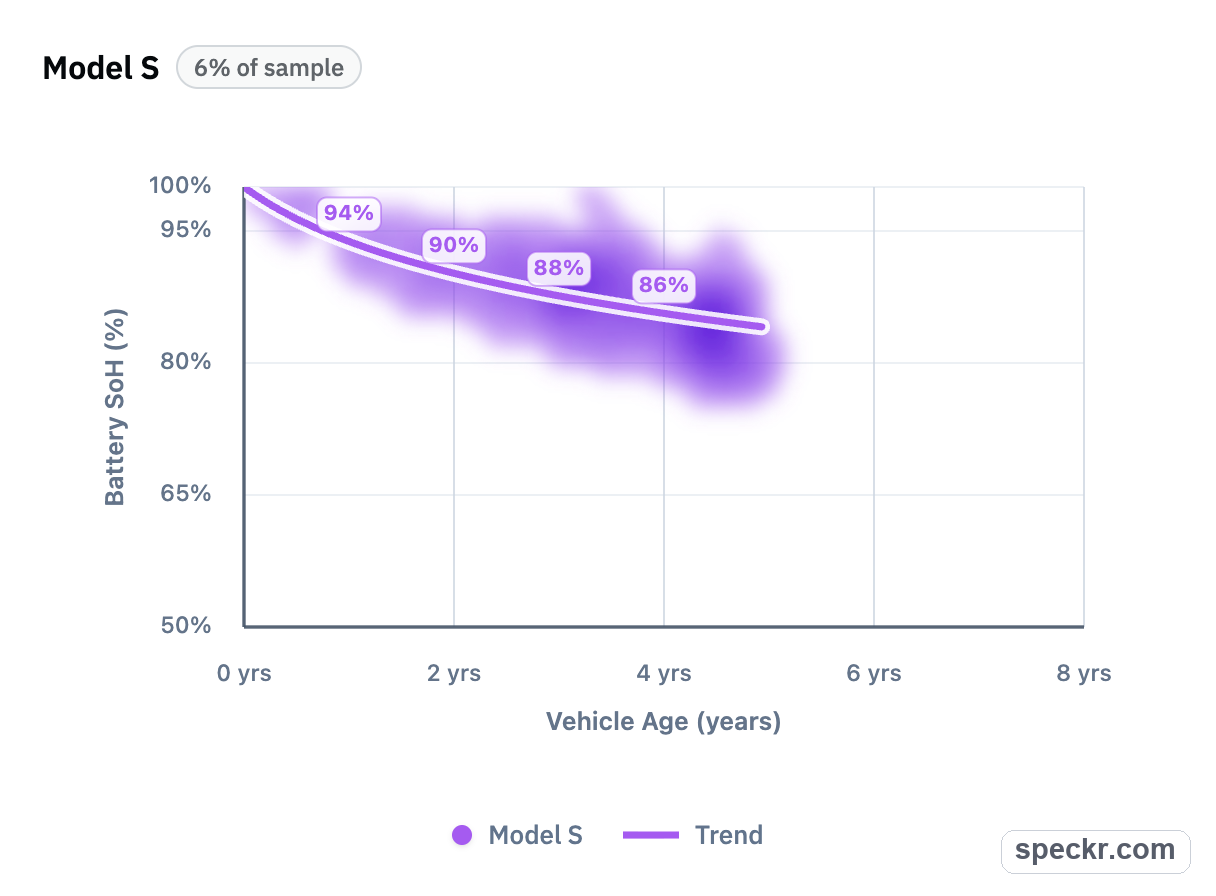
Model S and Model X are smaller but still useful cohorts
Model S and Model X appear with smaller sample shares. Their charts still show the same basic reality: battery health tends to move lower with age, but the spread around the trend line is just as important as the average.
Battery chemistry and cell type tell another part of the story
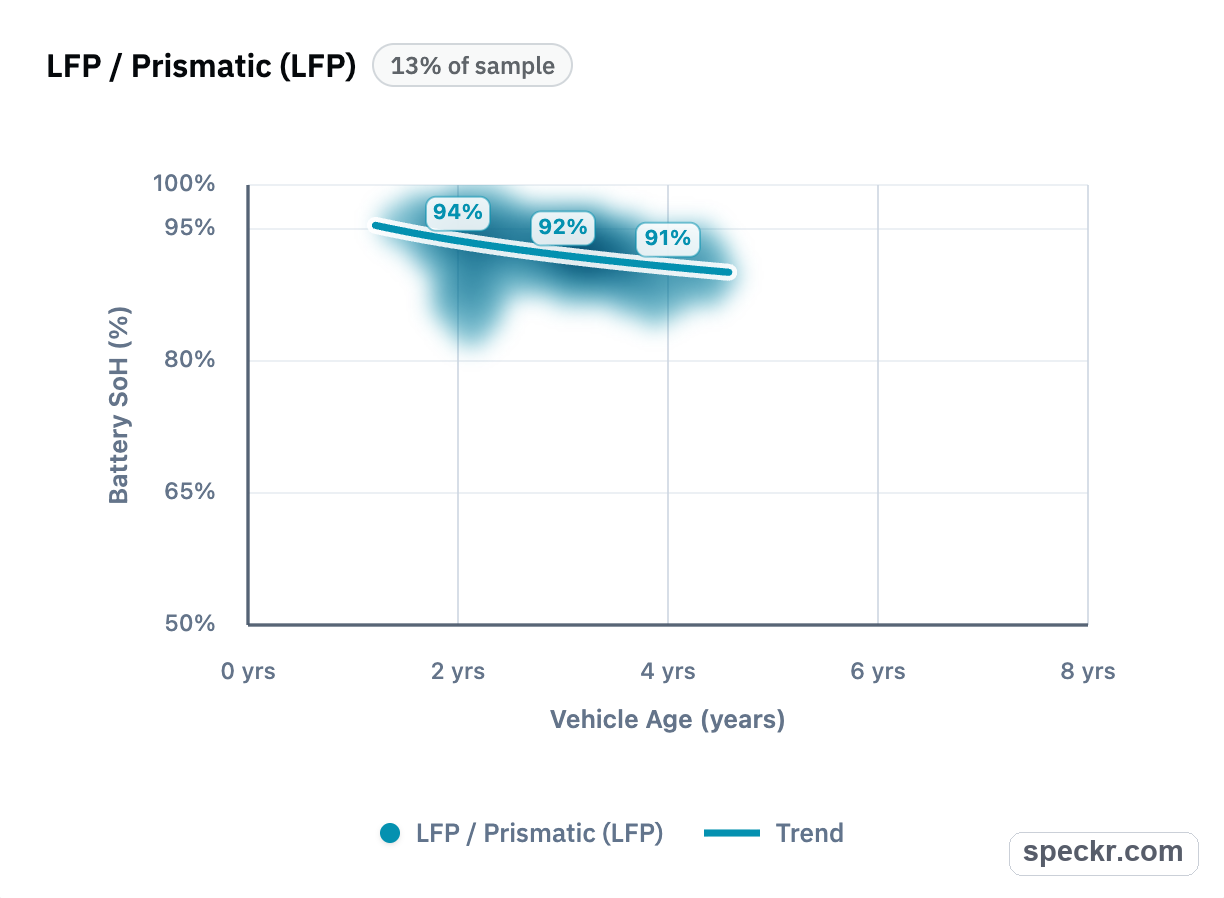
The chemistry ranges in this chart reflect both battery behavior and Tesla's production history. NCA appears across the widest age range because it was used across a larger and older portion of Tesla's fleet, especially earlier nickel-based long-range vehicles.
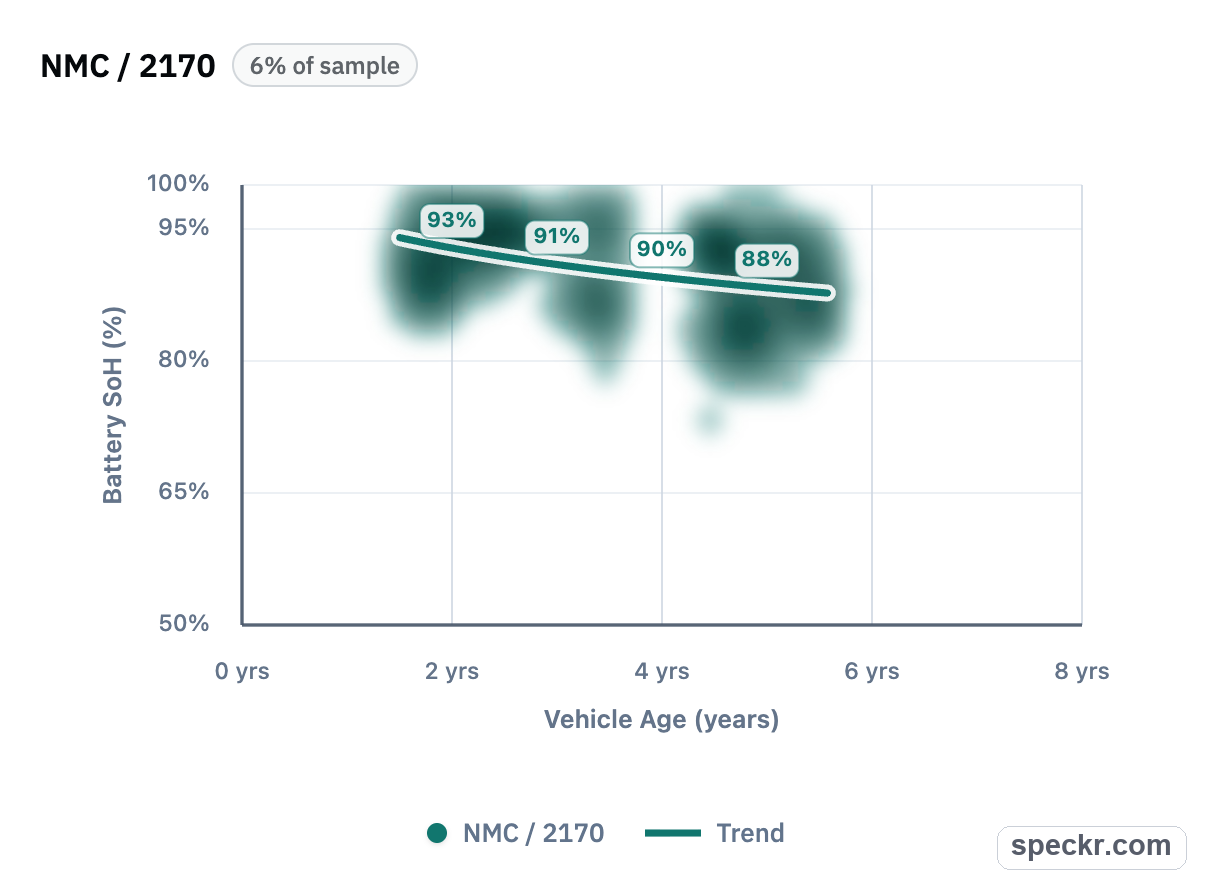
LFP appears in a narrower window because Tesla introduced it later, primarily for standard-range Model 3 and Model Y vehicles, including many China-built cars and U.S. Model 3 RWD vehicles. NMC appears in a narrower range as well because it is tied to specific supplier, factory, and market combinations, especially LG-supplied packs used in certain Model 3 and Model Y Long Range and Performance configurations in Europe and parts of Asia.
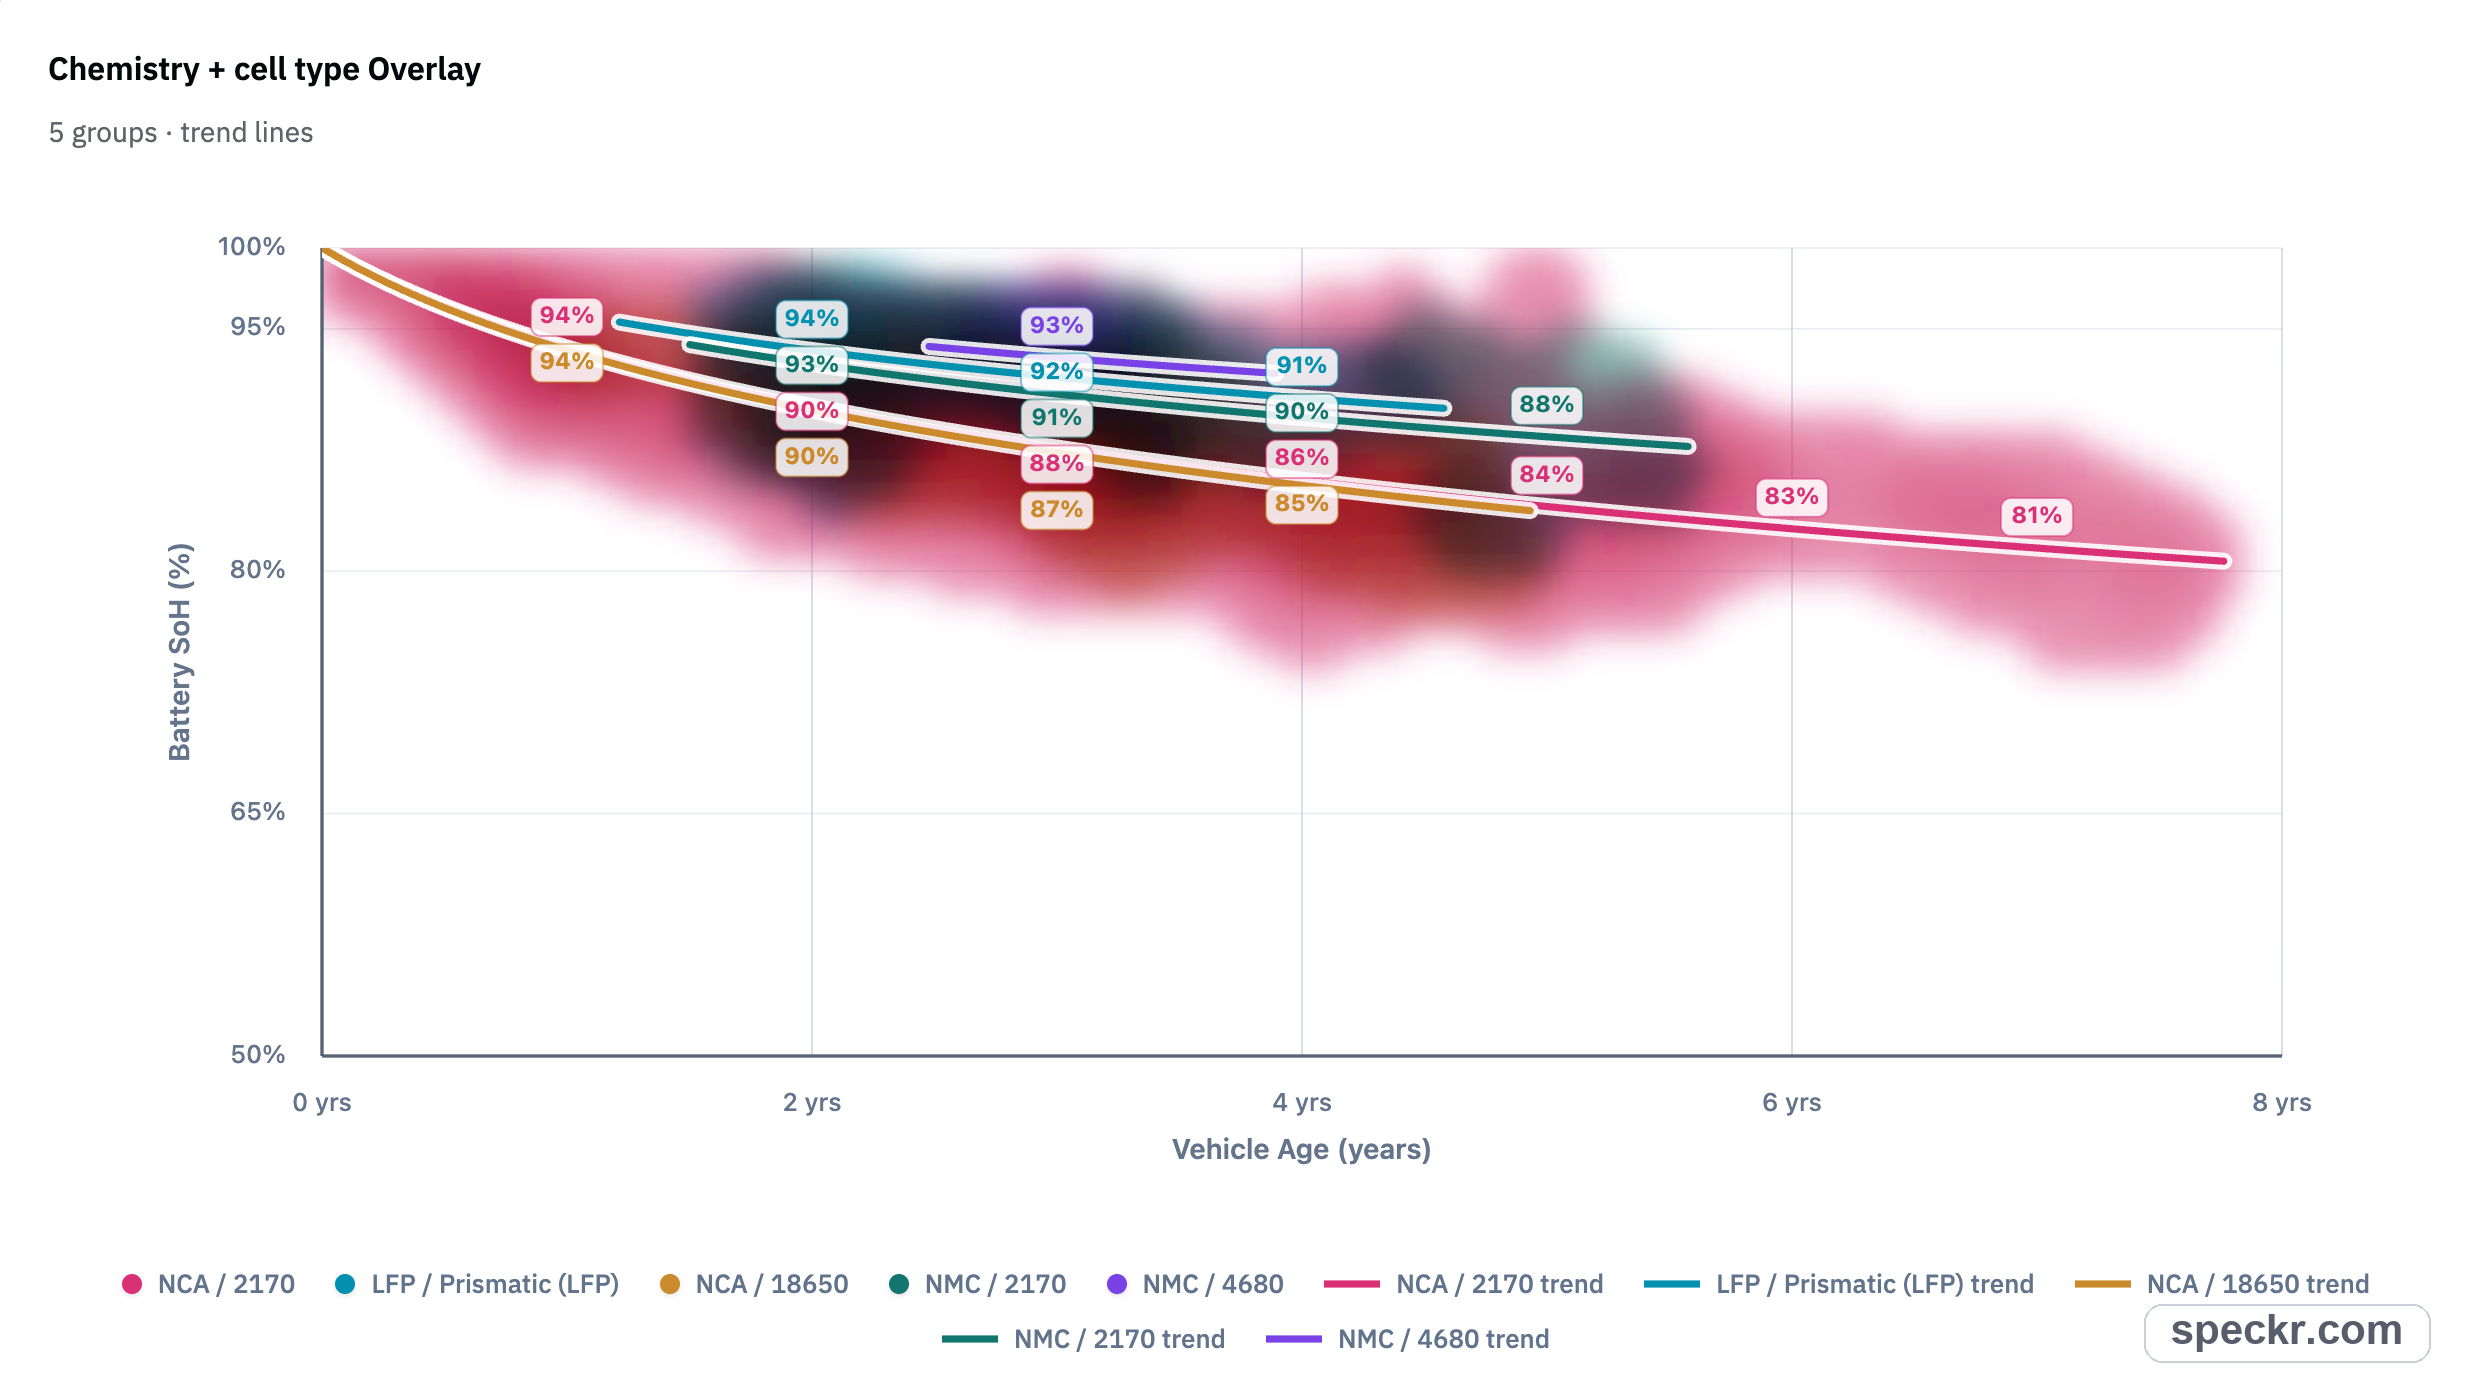
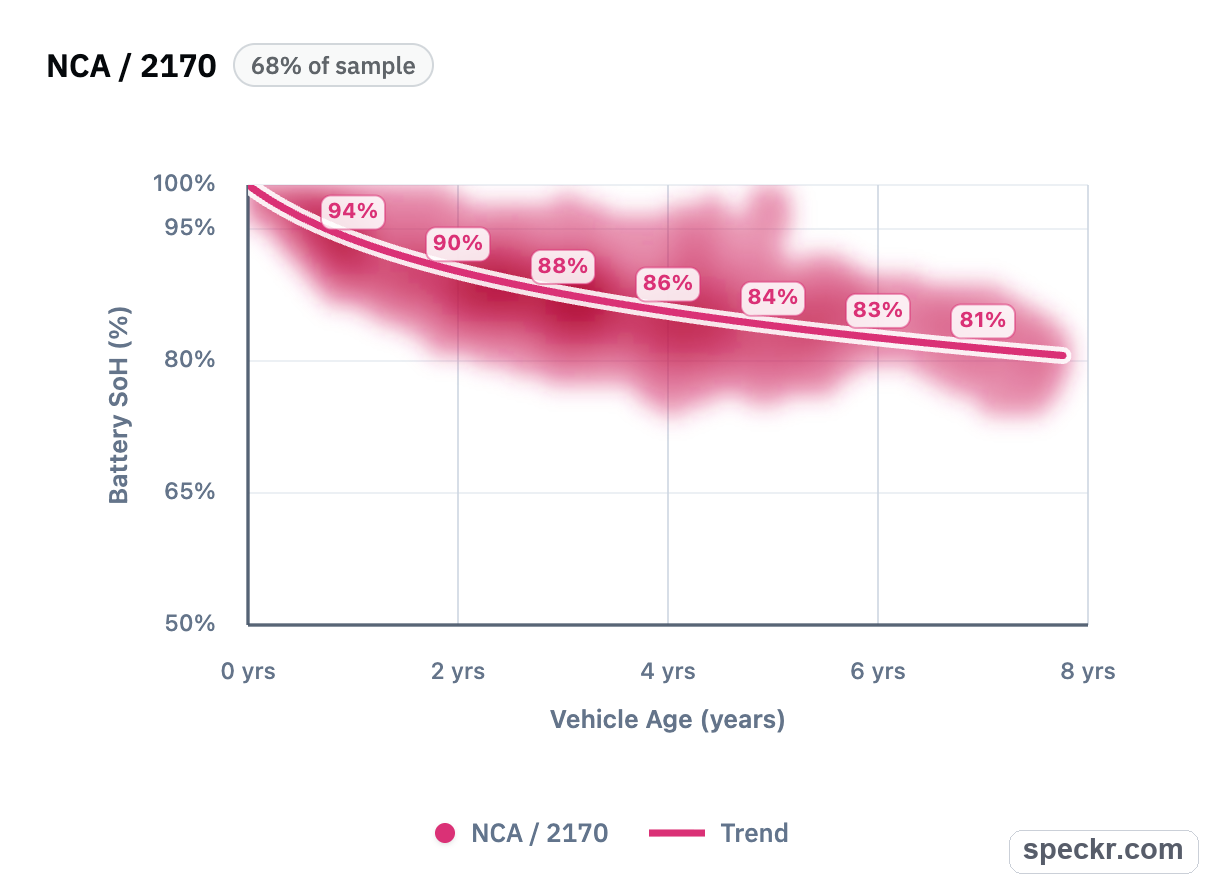
NCA remains the largest chemistry group in this sample
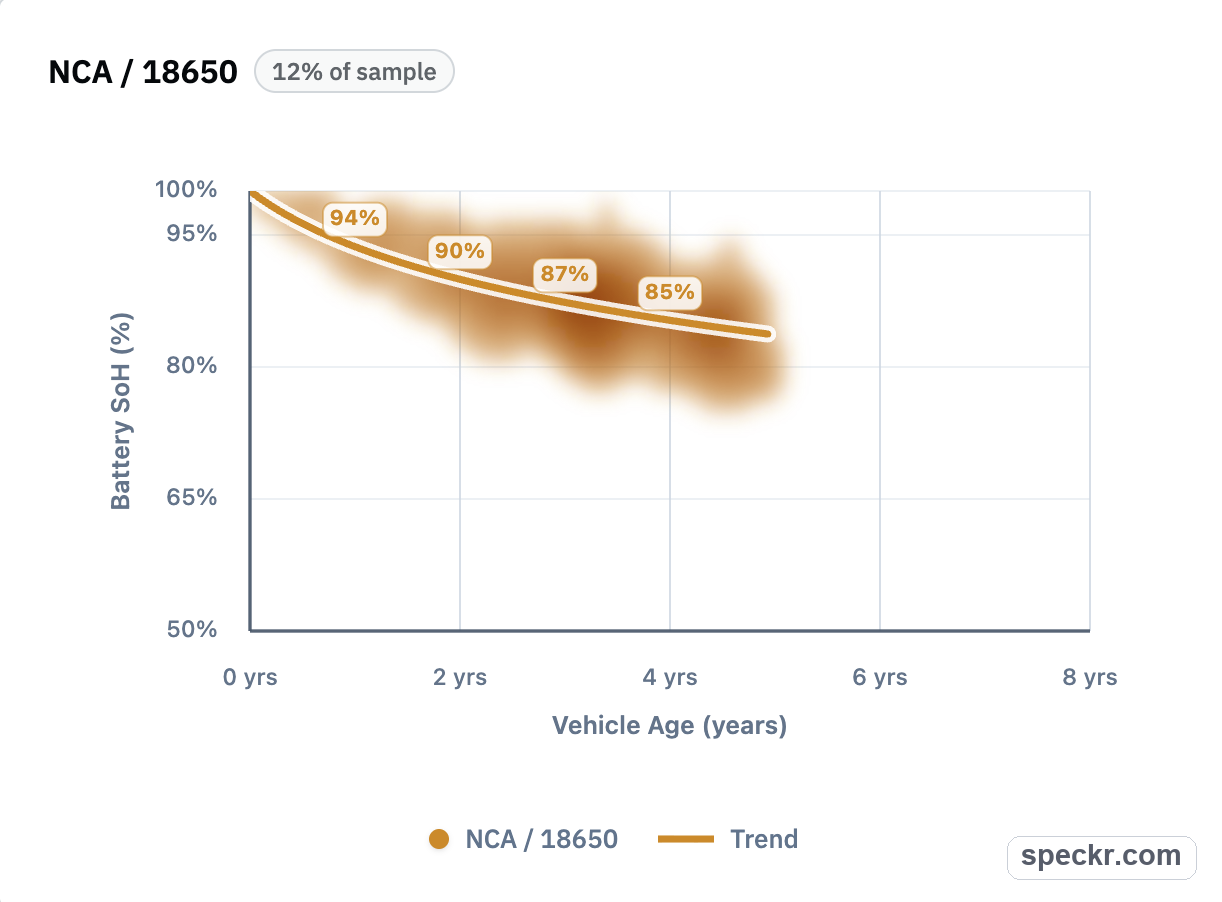
NCA / 2170 is the largest group in this dataset at 68% of the sample, while NCA / 18650 represents 12%. The 18650 group appears across an older part of the fleet, which lines up with Tesla's earlier production history.
LFP and NMC reflect more specific production windows
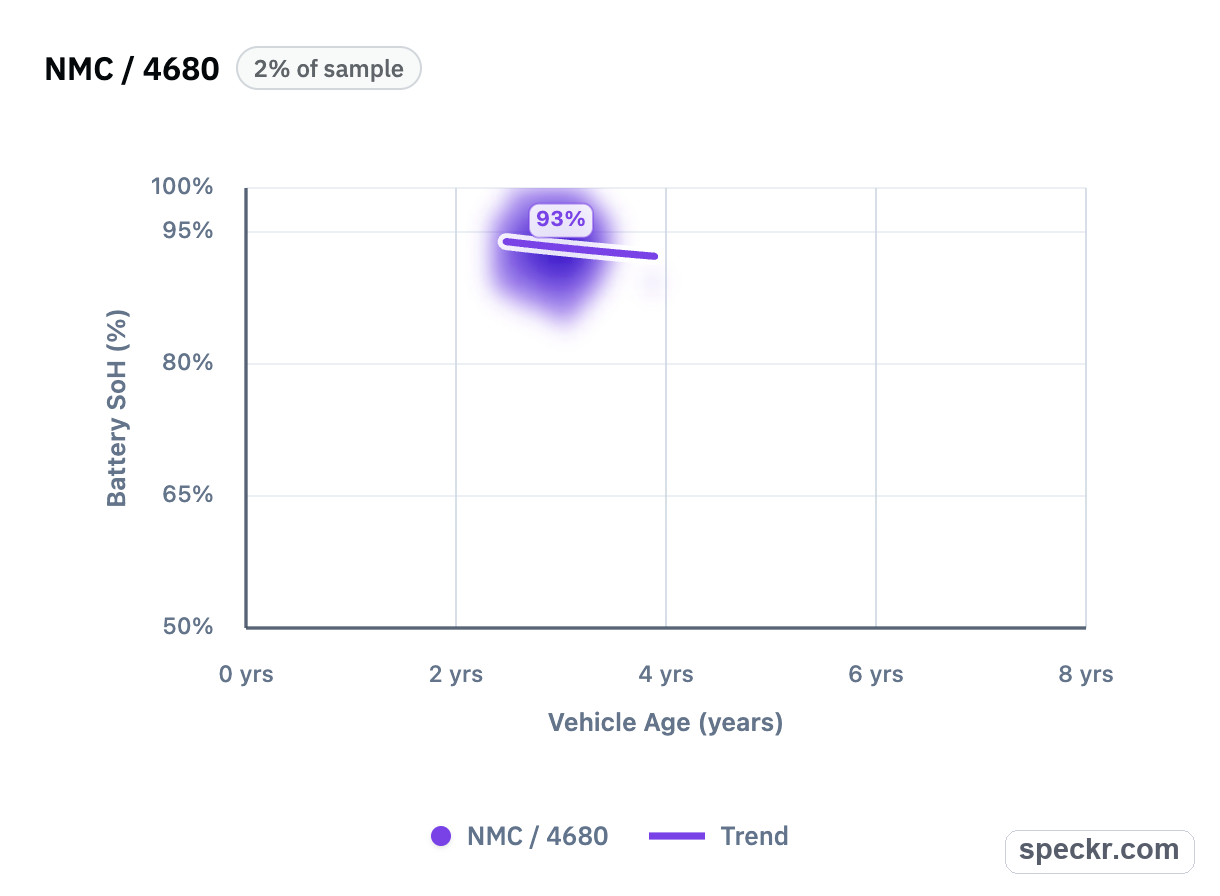
LFP / Prismatic accounts for 13% of the sample and appears across a narrower age range. NMC / 2170 is smaller at 6%, while the NMC / 4680 group is only 2% of the sample in this chart.
Mileage and vehicle context still matter
Users can optionally add mileage, price, and other details to cars in their My Vehicles page. We are seeing users add data there on a daily basis, and we plan to share findings from that data in the future as well.
So far, vehicles with higher mileage are showing the expected slight increase in battery degradation compared with the fleet average. Higher mileage already affects price in the traditional used-car market, and EVs are no different. Battery health adds another signal. It does not replace condition, age, mileage, accident history, options, tires, or the normal used-car diligence buyers and dealers already do.
An important Cybertruck limitation
Cybertruck uses Tesla's 4680 cell architecture. The NMC / 4680 population shown here appears to be limited to Austin-built Model Y vehicles with Tesla's 4680 structural pack, and should not be interpreted as representative of the full 4680 fleet.
Conclusion
The encouraging finding is that battery health looks fine for the majority of the fleet we analyzed. Tesla batteries do degrade over time, but for most vehicles in this dataset, the decline appears gradual and within a normal expected range.
That is where Speckr is most useful for buyers. Instead of guessing, shoppers can see whether the specific car they are considering has battery health that looks typical for its age, model, and battery type. As we see more and more VINs decoded, we'll continue to share insights into what we are seeing.
Comments
Comments appear after Speckr reviews them.
Add a comment
Log in with your Speckr account to submit a comment for review.
Log in to comment